


London Clay and Climate Change… What Does Our Moisture Data Say?
Geotechnical
If you’re building in London, your site may be located on the London Clay Formation, and the moisture content of this fine grained soil matters more than you might think. Clays swells when wet and shrinks when dry, and with more extreme weather conditions and seasons anticipated with climate change, that behaviour is worth understanding. So, we dug into our own archive, including our most recent 2026 samples, to see what the numbers say.
What was looked at
We analysed 108 laboratory moisture content results from 35 of our London projects, sampled between March 2018 and July 2026, between depths of 0.50 – 30.00m below ground level (bgl). For the 95 readings up to 2024, we also assessed the moisture contents where the soils started behaving like plastics (low moisture content), known as the plastic limit, and liquids (high moisture content), known as the liquid limit. The 13 readings from 2026 were logged as approximate ranges and without plasticity tests, so treat them as indicative.
What the data shows
- Typical stiff London Clay
The average moisture content was ~29.00%, with a range of 13.00 – 44.00%). Where plasticity was tested, the moisture content of the sample was ~2.60% greater than the average plastic limit. That is what we’d expect from stiff, overconsolidated clay, neither saturated nor badly desiccated.
- Yearly averages swing, but the samples differ
The average moisture content fell from 31.80% in 2019 to 25.20% in 2022, before increasing to 30.80% in 2026. The most robust year is 2021where 47 readings from 16 sites averaged 27.20%. 2019, 2022 and 2024 each rest on one or two sites, and 2026 has seven.
- Decreasing Annual Average Moisture Content, Except 2026?
The average moisture contents of the clay samples drops annually from 2019. This could be representative of generally dryer weather patterns; however, there is a jump in 2026, possibly associated with a wet winter and the date of the sampling undertaken relatively early in the year.
- Moisture peaks at 4.00-6.00m bgl
Moisture contents rise from 25.90% between ground level and 2.00m bgl to 31.30% between 4.00-6.00m bgl, before decreasing to 25.80% below 10.00m bgl. Four of the 2026 readings from 4.00-6.00m averaged 36.00%, which is well above earlier results at that depth (30.00%), so part of the 2026 increase in annual moisture content is simply due to the depth of the sampling
- High volume change potential
72% of the readings with plasticity data had a modified plasticity index above 40%, which NHBC standards classify as high volume change potential.
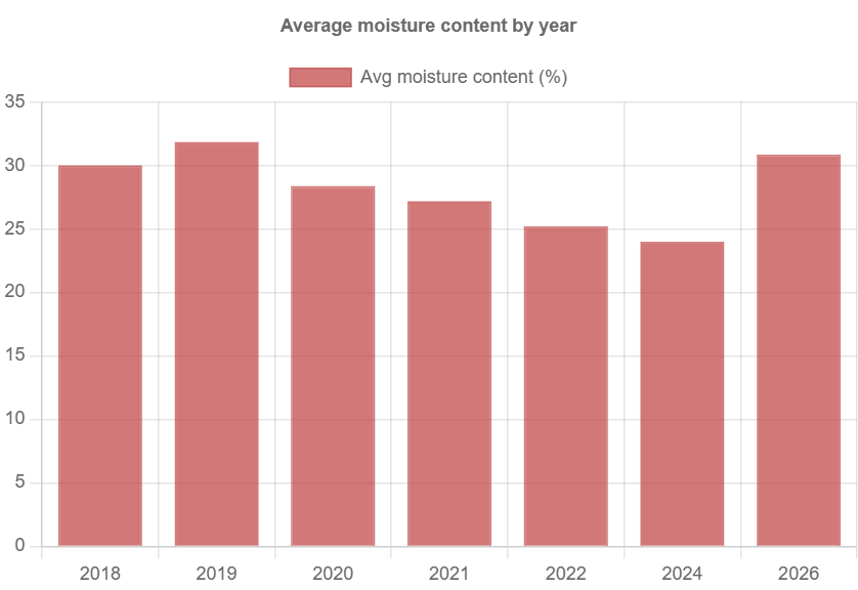
Figure 1: average moisture content by year, 2018-2026, with readings and sites labelled
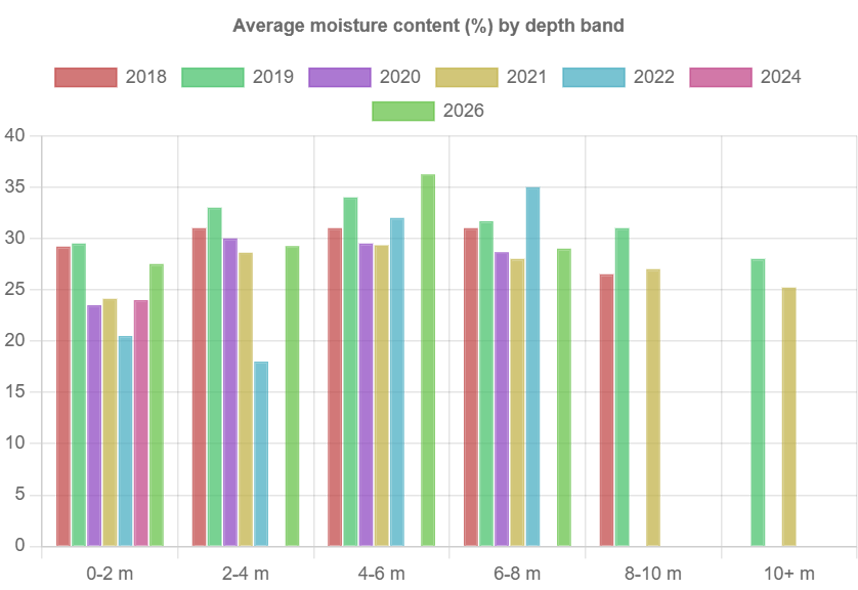
Figure 2: average moisture content and plastic limit by depth band
Why does it look like this?
- Soil type sets the baseline
A clay’s water content scales with its plasticity. The plastic limit rises from 22.60% at ground level to 2.00m bgl to 28.40% at 6.00-8.00m bgl, and moisture content mirrors that trend. Allow for plasticity (Using the liquidity index) and the depth pattern is largely flat. Shallow soils probably include Made Ground, Superficial Deposits and weathered London Clay.
- Every year samples different ground
Our reading’s come from different sites rather than repeat visits to the same location, so year-to-year change mostly reflects which soils were sampled. The 2026 batch added seven new sites and shifted the picture noticeably.
- Weather before sampling matters
Most 2018 samples were taken between March and June, before summer months, which fits their high average liquidity index (0.16%); however, the 2022 results were taken in October, after the summer. They are consistent with drying but come from a single site, so they are only suggestive.
- Near-surface drying is modest
Tree roots and evaporation dry the upper clay, and 5 of 19 readings above 2.00m fell below their plastic limit and were classed as having moisture deficits. That share (26%) matches the dataset (25%), so we can’t pick out a distinct dried-out crust without knowing where the trees are.
What this means for your project
With most of the clay classified as having high-volume change potential and the moisture content sitting close to the plastic limit, a drought or tree-root uptake can shrink it, and later rewetting can cause heave. The ground isn’t at a moisture extreme, but it is sensitive to change. Foundation design, tree management and any climate-related assessment should use site-specific moisture and plasticity profiles, not regional averages.
Pro tip: Always pair moisture content with Atterberg limits. On its own, a high or low moisture content can’t tell you whether the clay is wetter or drier than usual or is simply a different clay, as well as the physical properties of the soil sample, such as the plastic limit, liquid limit and volume change potential classification.
Final thoughts
Our data can’t yet separate climate from site effects, because it lacks repeat measurements at fixed locations, tree positions and weather records. However, the average results do show that moisture contents are affected by seasonal variations and climate change.
Author: Alex Bennett & Callum Urquhart